
Product
Production allocation software, with a trace behind every barrel.
ReservoirLedger is production allocation software for operators who allocate in Excel today. It is not a reservoir simulation or reserves tool: it allocates measured production back to wells and partners, and produces the daily and monthly reports that follow.
What this page describes
What it does
Allocation you can explain to a partner.
The same disciplines a production accountant applies by hand, made repeatable: a method written down, inputs checked, runs that cannot be overwritten and approvals that leave a trail.
A written accounting method
Before any engine code runs, the method is specified per allocation profile: the algorithm per phase and node, conservation rules, exception policies, tolerances, rounding and manual overrides. You sign it, and the engine implements only what it says.
Excel-first import
Templates that look like your daily production report, row-level validation before anything is saved, an error report you can fix in Excel, and a mapping wizard for your own workbook layout.
Daily provisional allocation, monthly close
Daily facts are allocated provisionally each production day. The monthly close checks that every day is allocated, every well test approved and every override approved before the period locks.
A flow network that is yours
Fields, wells, completions, fiscal, allocation and check meters, tanks and the nodes and edges that join them define the allocation topology, with working-interest owners versioned over time.
A trace for every barrel
Every allocated barrel traces to its meter reading, well test, hours on, factor and any approved override. Runs are immutable and versioned: a re-run supersedes a run and never overwrites it.
Governance built in
Overrides need a reason and a second person. Approved months lock, and a later change is a restatement with its own reason and approval.
The screens
What a month looks like in the design.
Four of the screens being designed, drawn on fictional data. Each one answers a question a partner or an auditor asks.
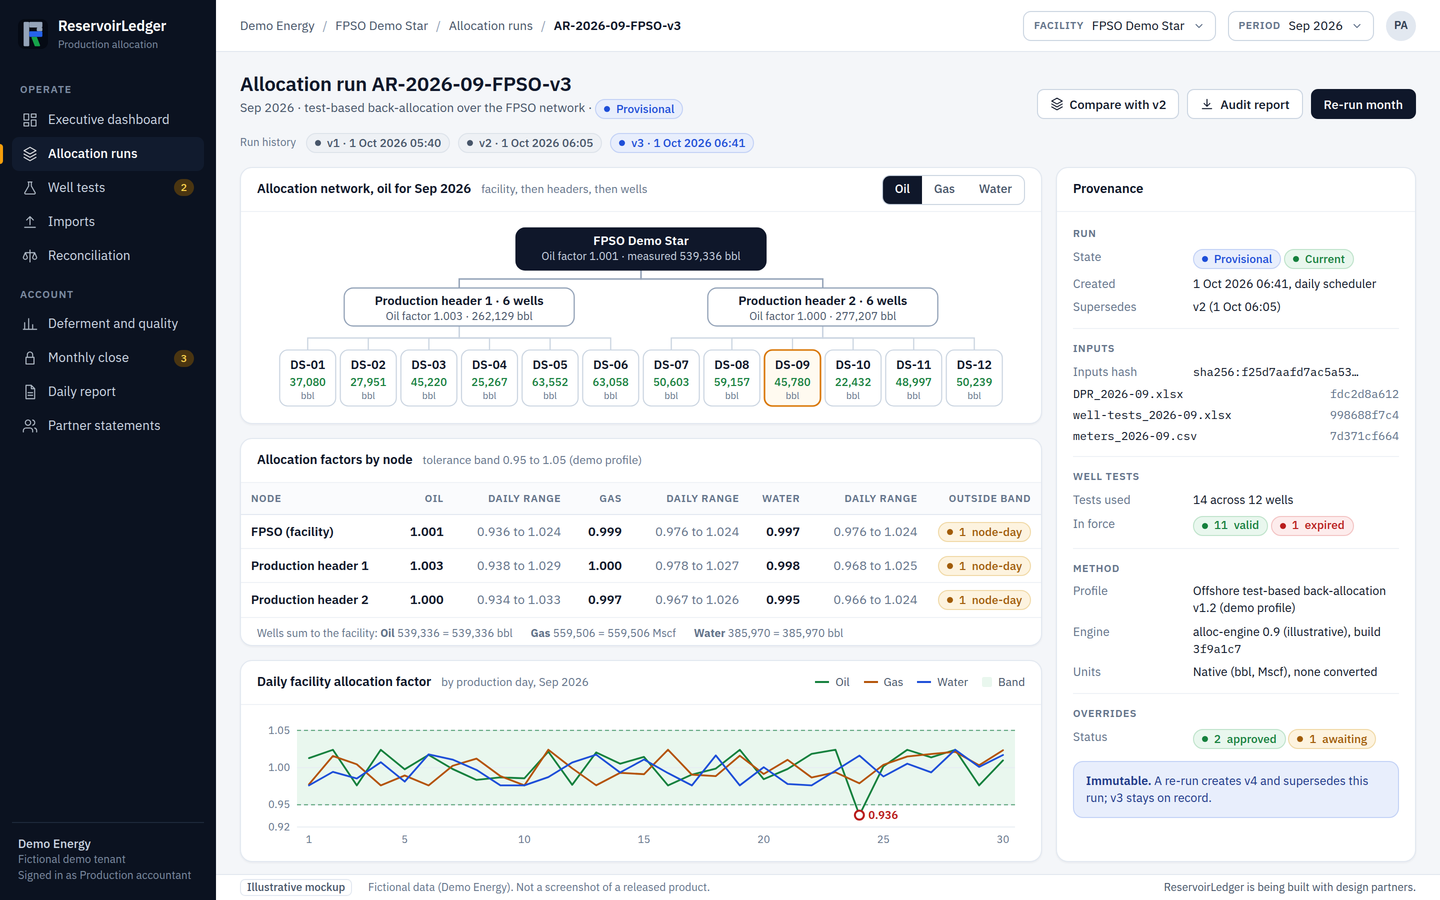
A trace for every barrel.
An allocation run shows the factor at every node of the flow network against the tolerance band, flags the day that falls outside it, and lists what the run was made from: the input hash, the well tests used, the profile and engine versions and the approvals. A re-run supersedes it and never overwrites it.
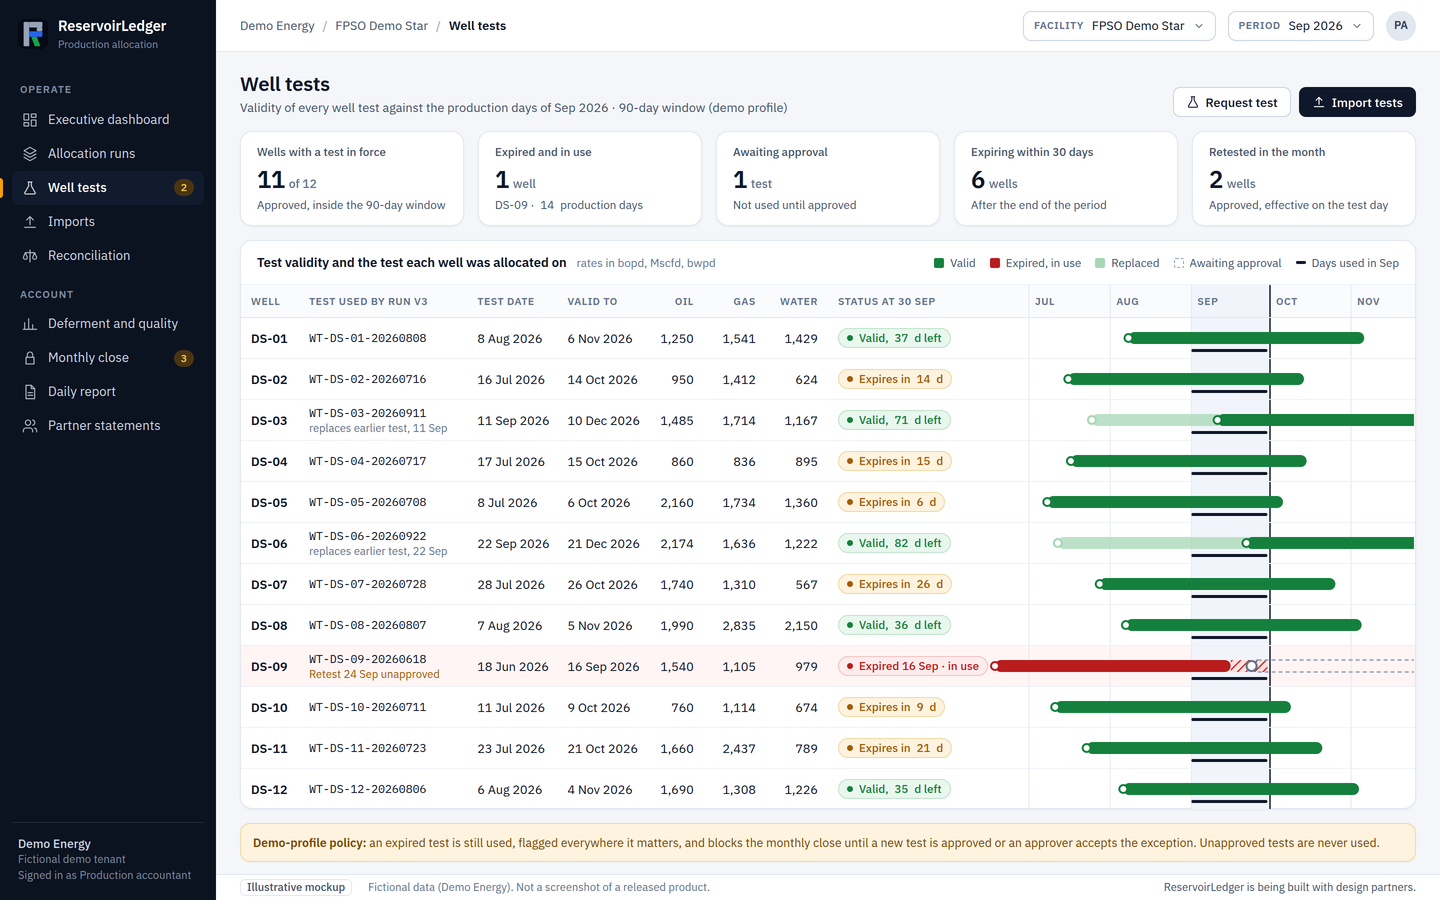
Well tests, with their validity.
Each well test is shown against the production days it covers, with the test a run used, the one that has expired and the one still waiting for approval. The method says what happens next; the screen shows it.
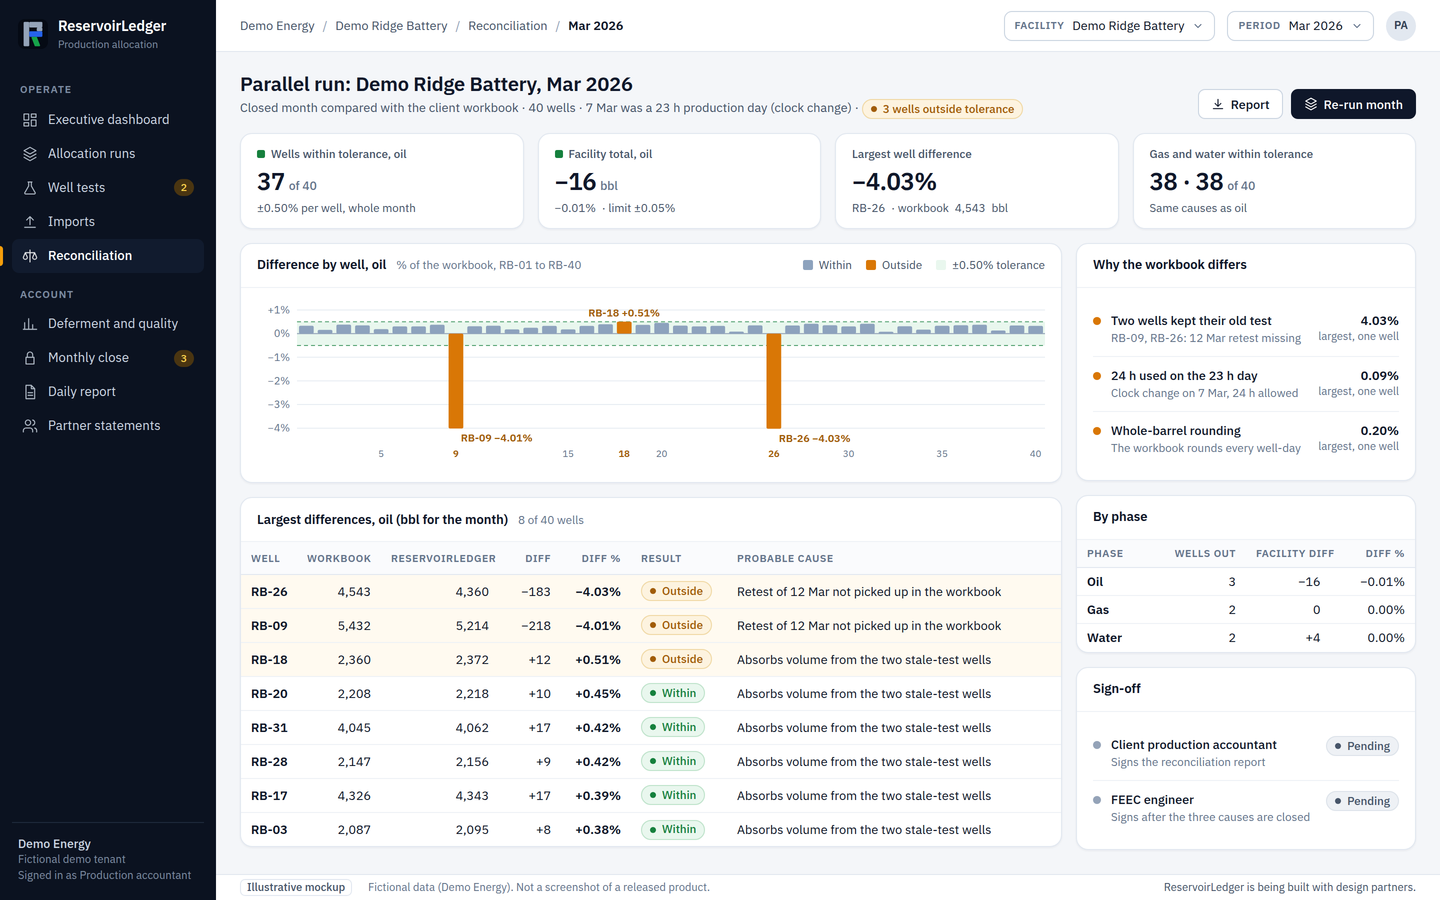
Your spreadsheet, beside ours.
In the pilot, a closed month is run through the engine and compared with your own workbook, well by well, against the tolerance agreed in the method. Each difference outside it is traced to a cause, such as a retest the workbook did not pick up.
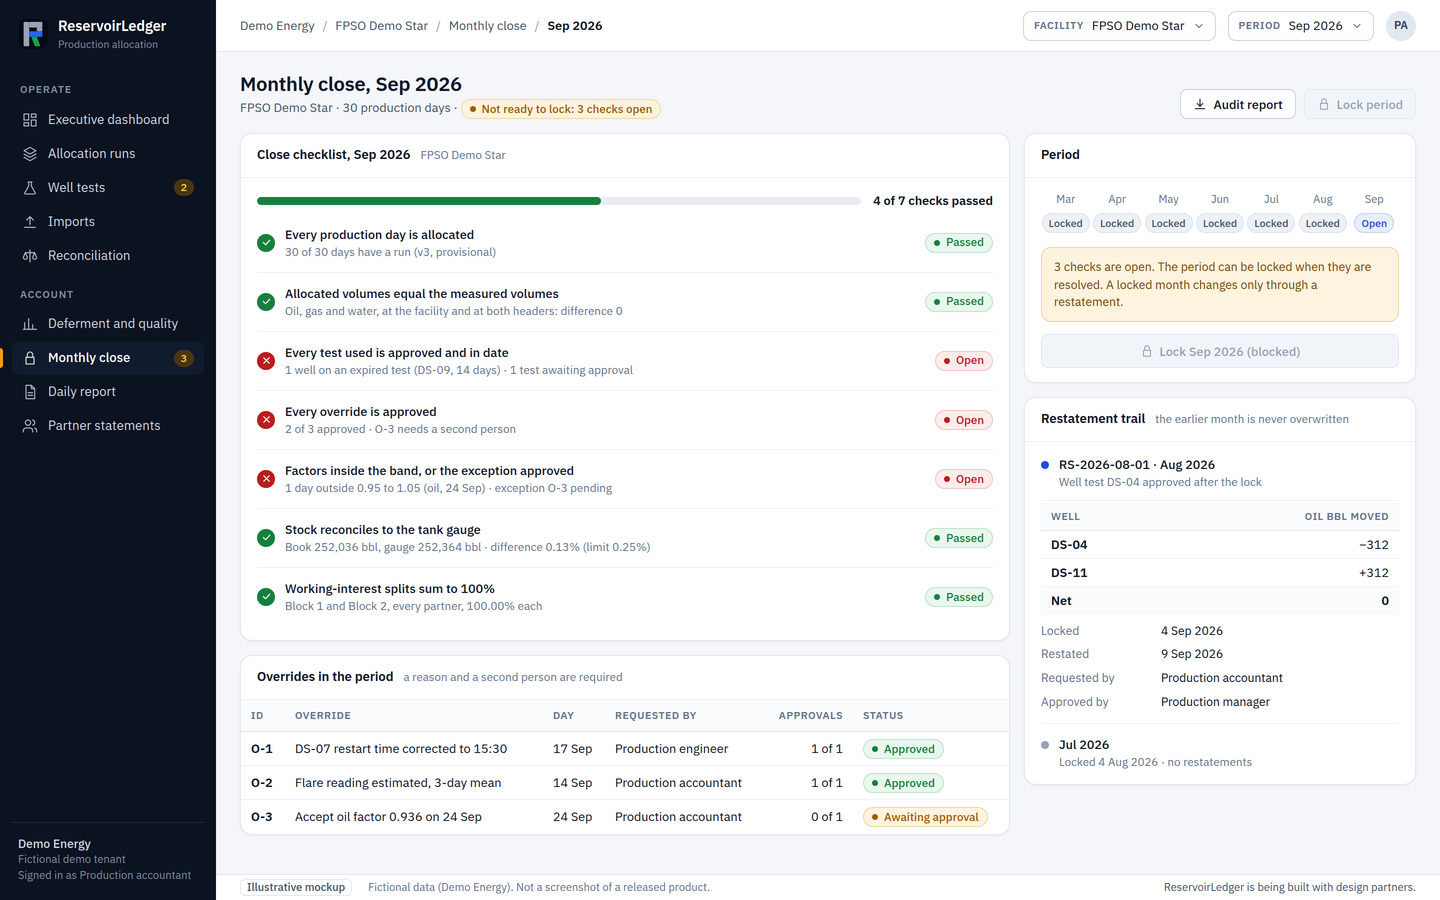
A close that cannot skip a step.
The month locks only when every day is allocated, every well test and override is approved and the balances agree. A later change is a restatement with its own reason and approval, kept in a trail.
Time and units
Production days and units, handled the way operators do.
- Production day. Each facility has its own cut-off time (06:00 by default) and time zone. Every daily value belongs to the facility’s production day, not to UTC midnight.
- Clock changes. A day on which the clocks change has 23 or 25 hours. Each production day stores its length, and hours on are checked against that length, never against 24.
- Native units. Oil, condensate, gas and water are shown in their own units. Barrels of oil equivalent appear only after you set your own conversion factor; there is no default value.
- Gas conditions. Reference conditions are explicit for each meter and never assumed.
Daily data
What the daily workbook carries.
- Well status, hours on, choke and pressures
- Well tests, with approval and validity rules
- Meter volumes, tank gauges and stock
- Injection, fuel, flare and vent
- Deferment with reason codes
- Liftings and cargoes, run tickets and purchaser statements
- Budgets and forecasts
Dashboards
Seven views for management and engineers.
Native units throughout. Barrels of oil equivalent appear only when you have configured a conversion.
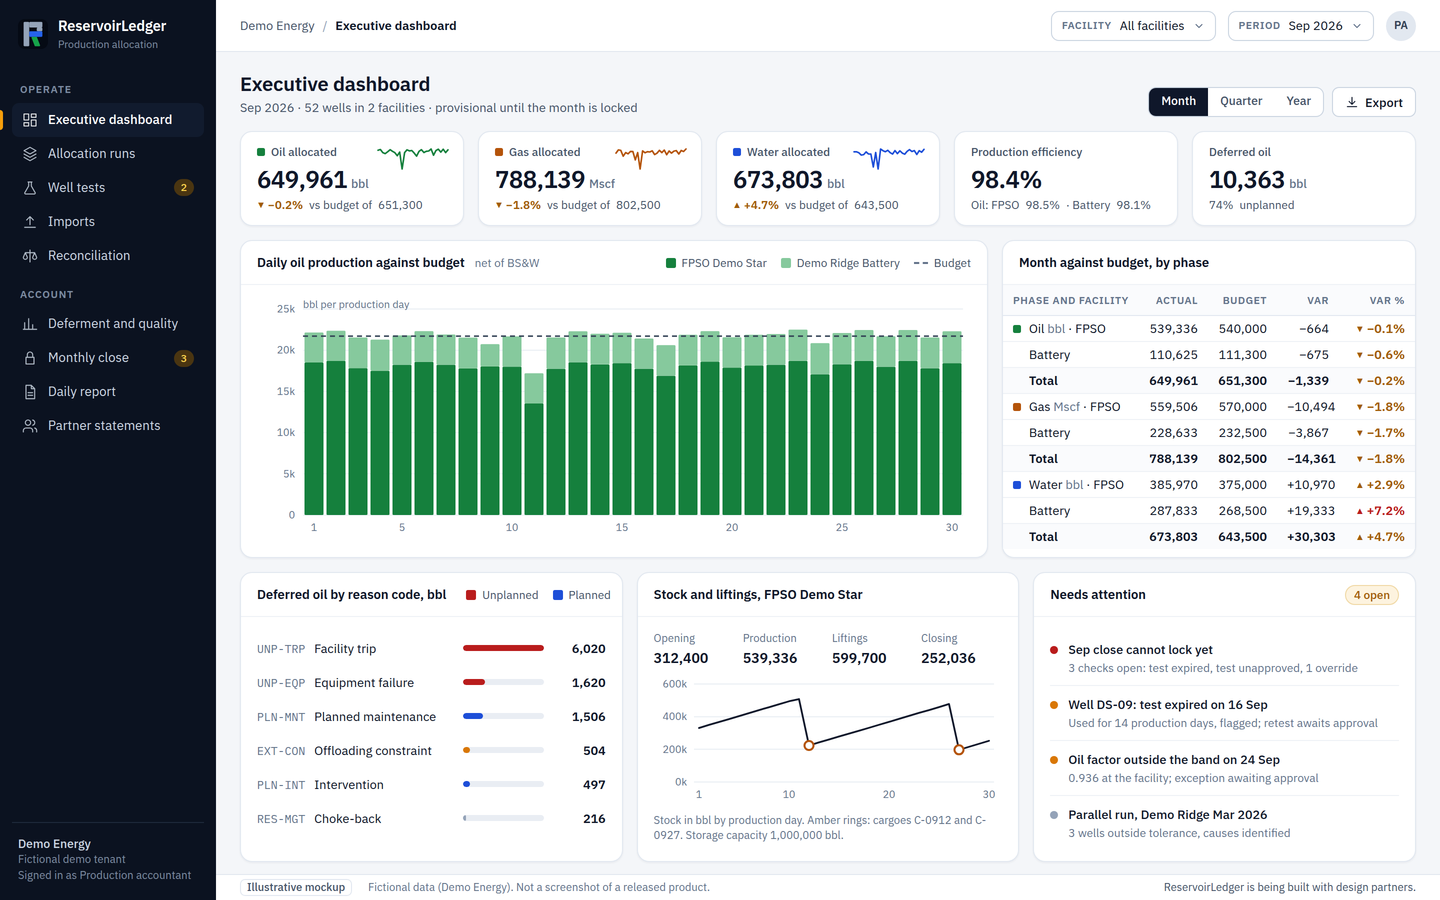
- 01Executive: production against budget, production efficiency, deferment, stock and liftings
- 02Field and asset ranking
- 03Well performance
- 04Allocation factors and balance, against the tolerance bands in the method
- 05Deferment Pareto
- 06Stock, liftings and partner shares
- 07Data quality
Reports
Outputs your team prepares and owns.
Outputs are report profiles: customer-prepared internal outputs.
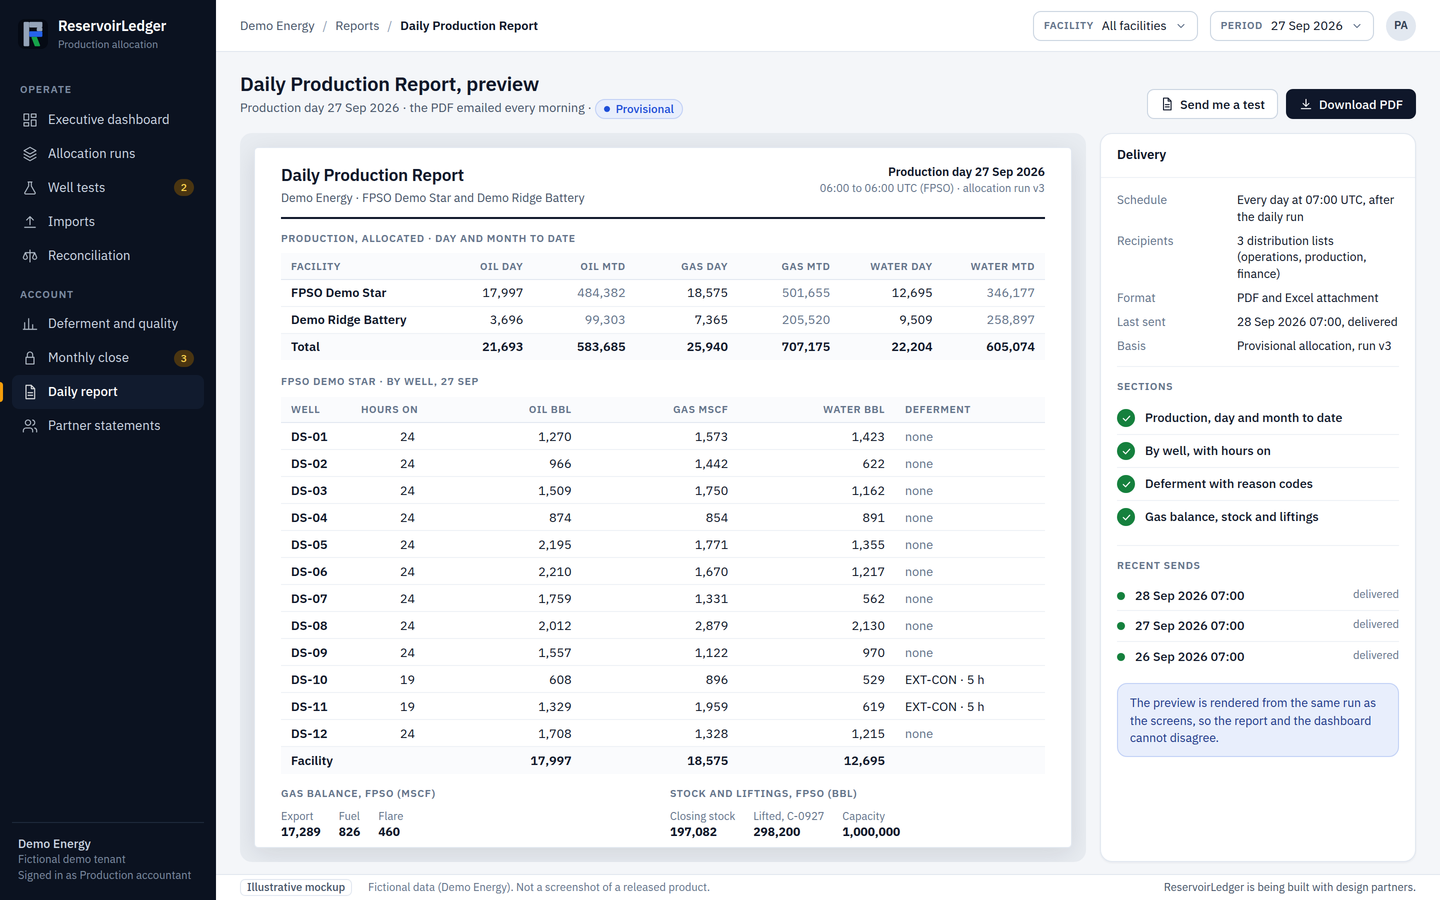
- The Daily Production Report, a PDF emailed every morning
- The monthly report
- The allocation audit report
- Partner (working-interest) statements
- The spreadsheet reconciliation report
- Excel exports and the full data export
Report profiles are not filings
Data and hosting
Customer data stays on a dedicated production host.
Real customer data never lives on shared demonstration or staging systems. It goes only to a dedicated production host, and only after that host is production-ready: hardened, restore-tested and pen-tested. Tenant isolation is enforced in the database.
Leaving is easy
A full data export, at any time.
The original source files; the normalised data as CSV and JSON; every allocation run with its provenance; the allocation-profile versions; and the audit log with approvals.
Illustrative example
Why a small misallocation matters.
An illustration of scale, not a measured result and not a promise.
Illustrative, not a customer result
At 5,000 bopd and $70/bbl, a 0.5% misallocation is about $640k a year of value moving between partners or wells (5,000 × 365 days × $70 × 0.5%). A faster close, less key-person risk and fewer audit findings come on top of that.
Scope
What the first release leaves out.
Allocated volumes feed money, so the first release stays inside what can be tested against your own closed months.
- Revenue, royalty and joint-interest billing accounting
- PSC entitlement accounting: PSC clients get allocation only
- Volume correction factors, and component or mass allocation
- Reservoir simulation, reserves estimation and reservoir analytics
- Named regulator report formats: these are added one at a time, each with its own acceptance tests and legal review
- Mobile data entry
Let's talk
Bring us your closed month.
The pilot sets our allocation beside your own spreadsheet. Tell us about your facilities and how you allocate today.