
Product mockups
The screens we are designing, drawn on fictional data.
ReservoirLedger is being built with design partners. These eight mockups show how its main screens are designed to work: an FPSO and a US onshore battery for a fictional operator, with the numbers made to add up, so you can judge the design and tell us what is missing.
These are mockups, not screenshots
The eight screens
From the morning report to the monthly close.
Each mockup is captioned with what it shows. All figures come from one fictional dataset and are checked against it.
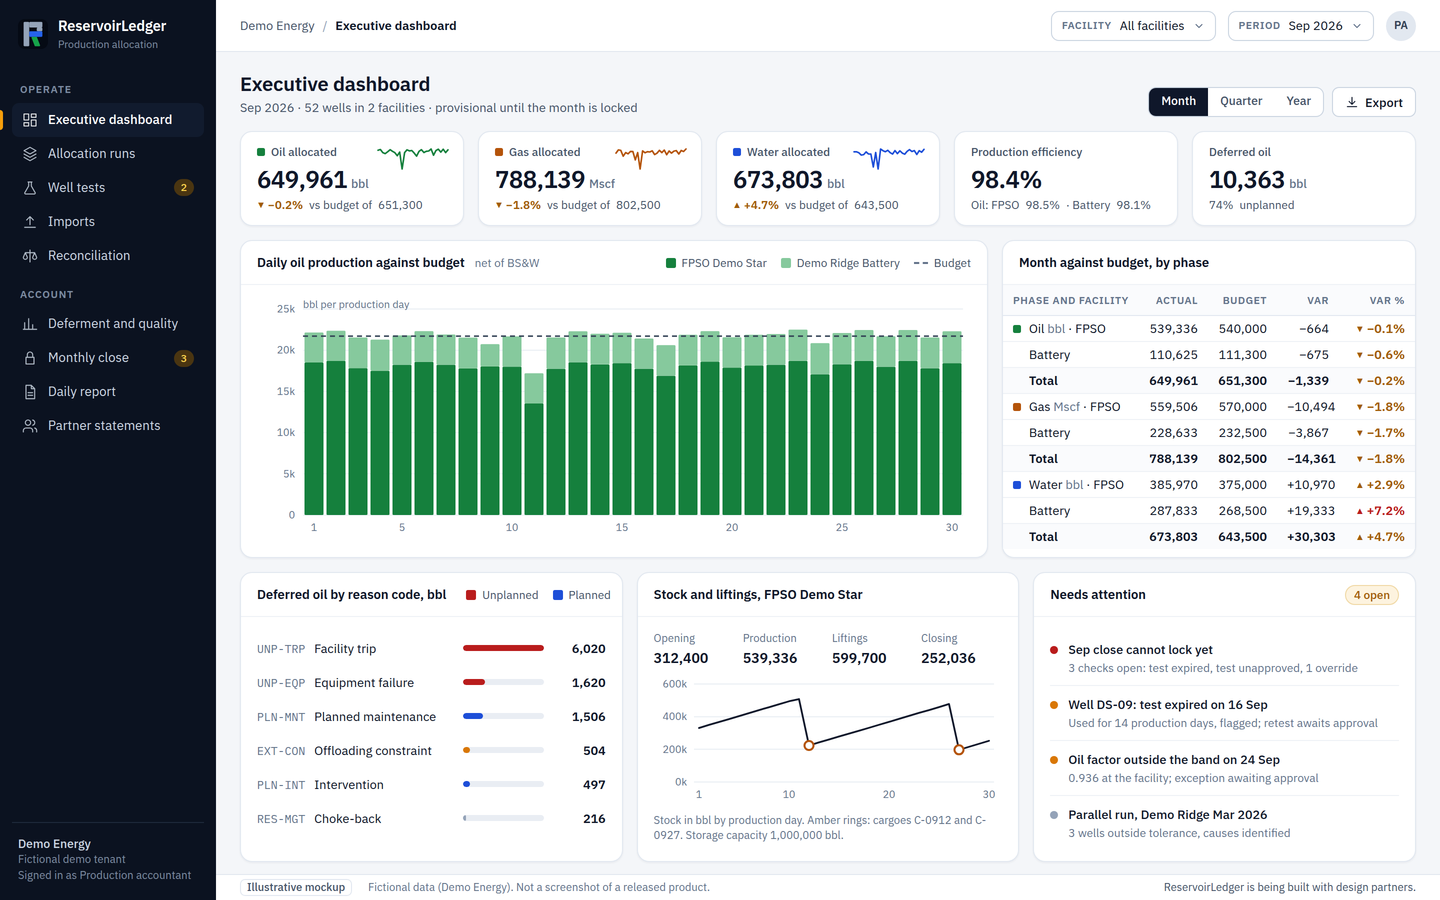
Executive dashboardOil, gas and water against budget in native units, production efficiency, deferred oil, a daily chart, deferment by reason and the stock and liftings of the FPSO.Illustrative mockup. Fictional data (Demo Energy). ReservoirLedger is being built with design partners. 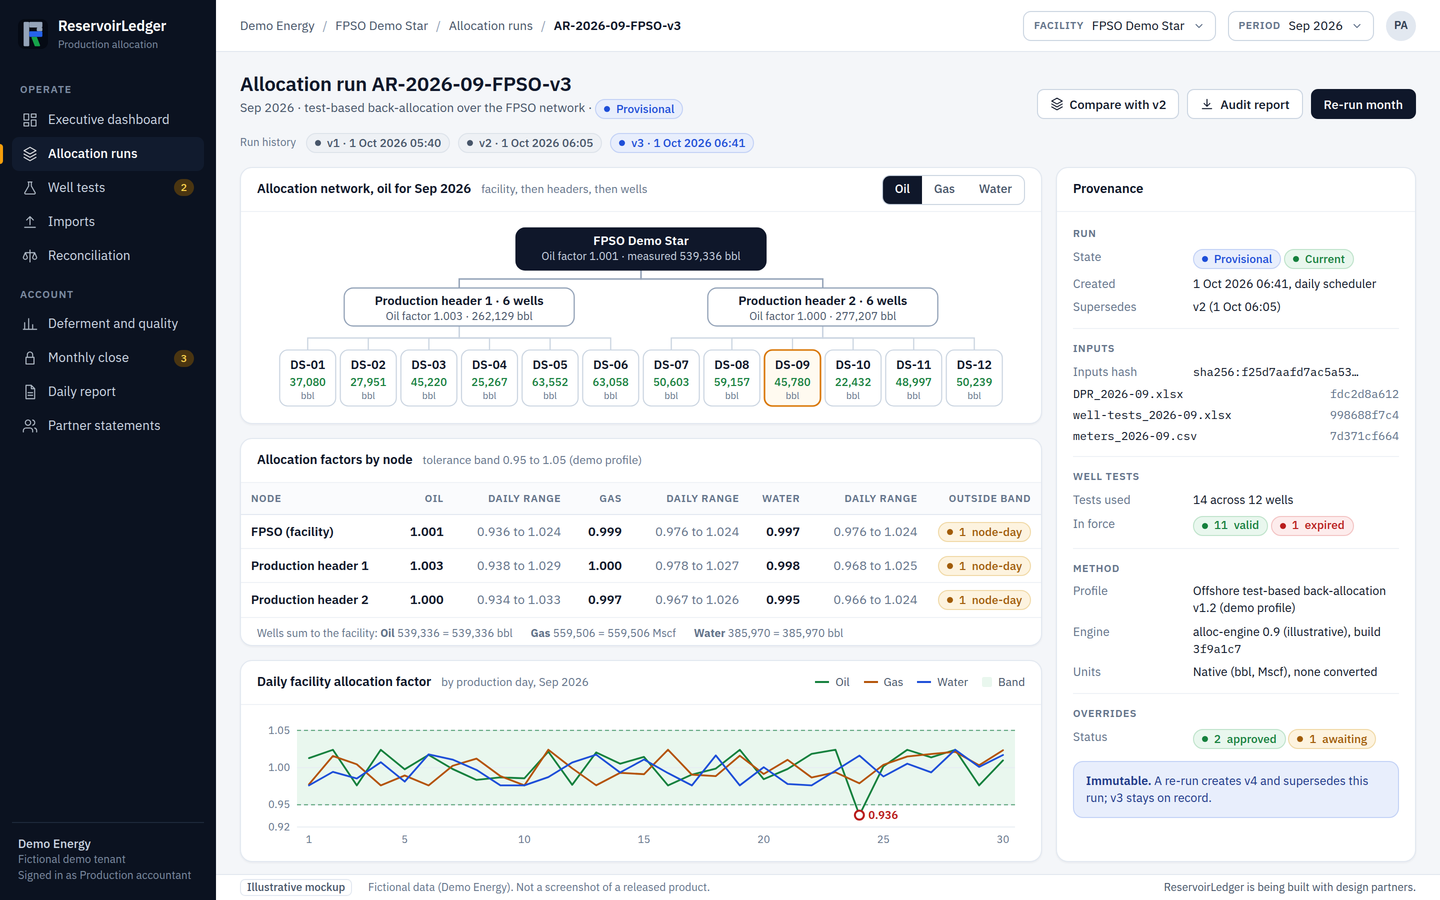
Allocation runOne month on a fictional FPSO network: the factor at every node against the tolerance band, and the provenance of an immutable, versioned run.Illustrative mockup. Fictional data (Demo Energy). ReservoirLedger is being built with design partners. 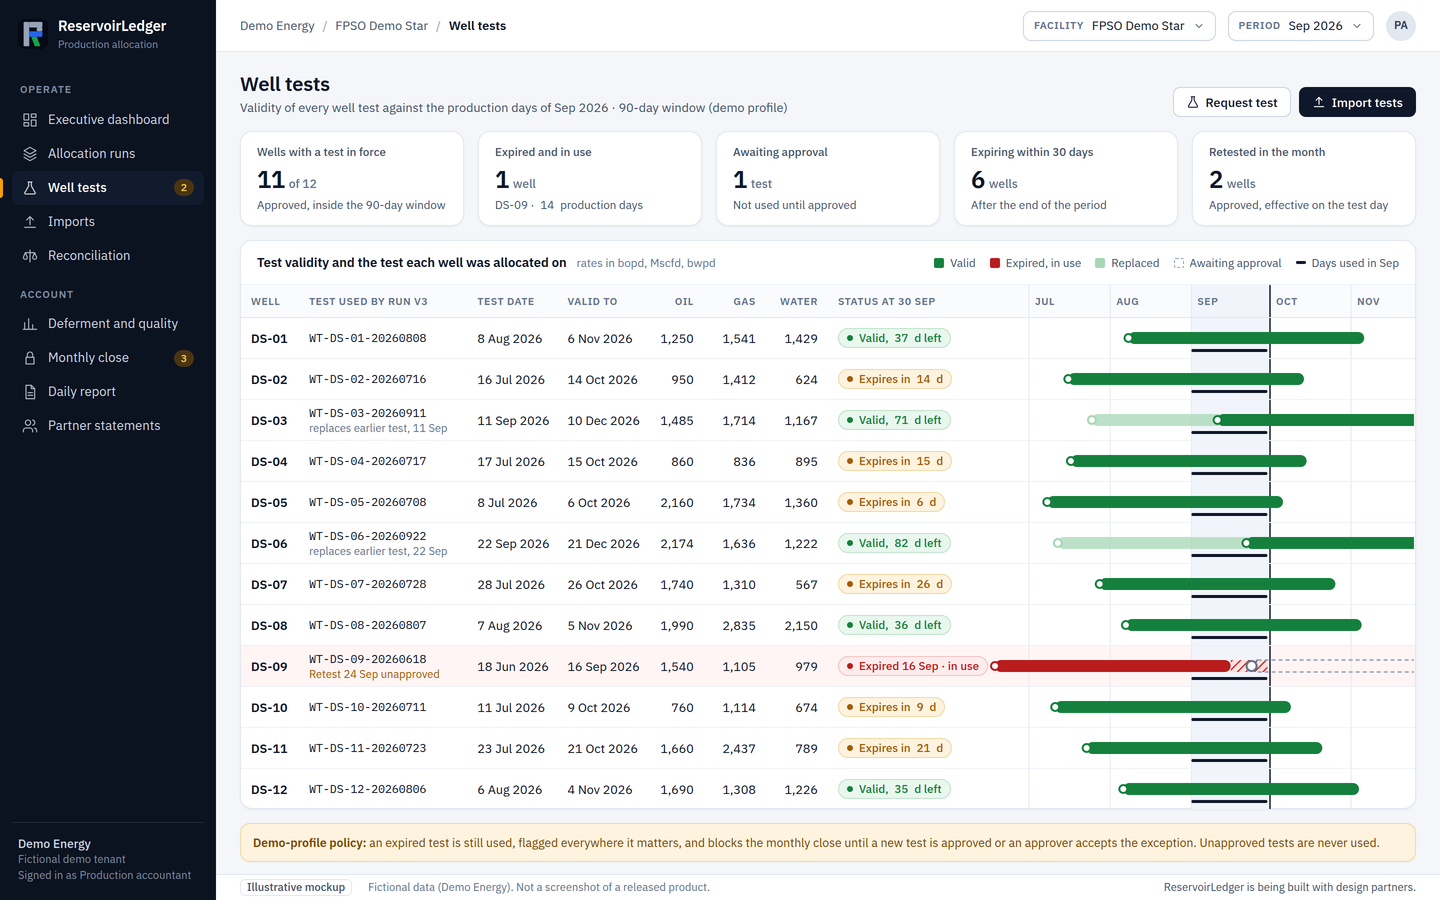
Well testsWhen each well test is valid, which test the run used for each well, and the one expired and the one unapproved test flagged.Illustrative mockup. Fictional data (Demo Energy). ReservoirLedger is being built with design partners. 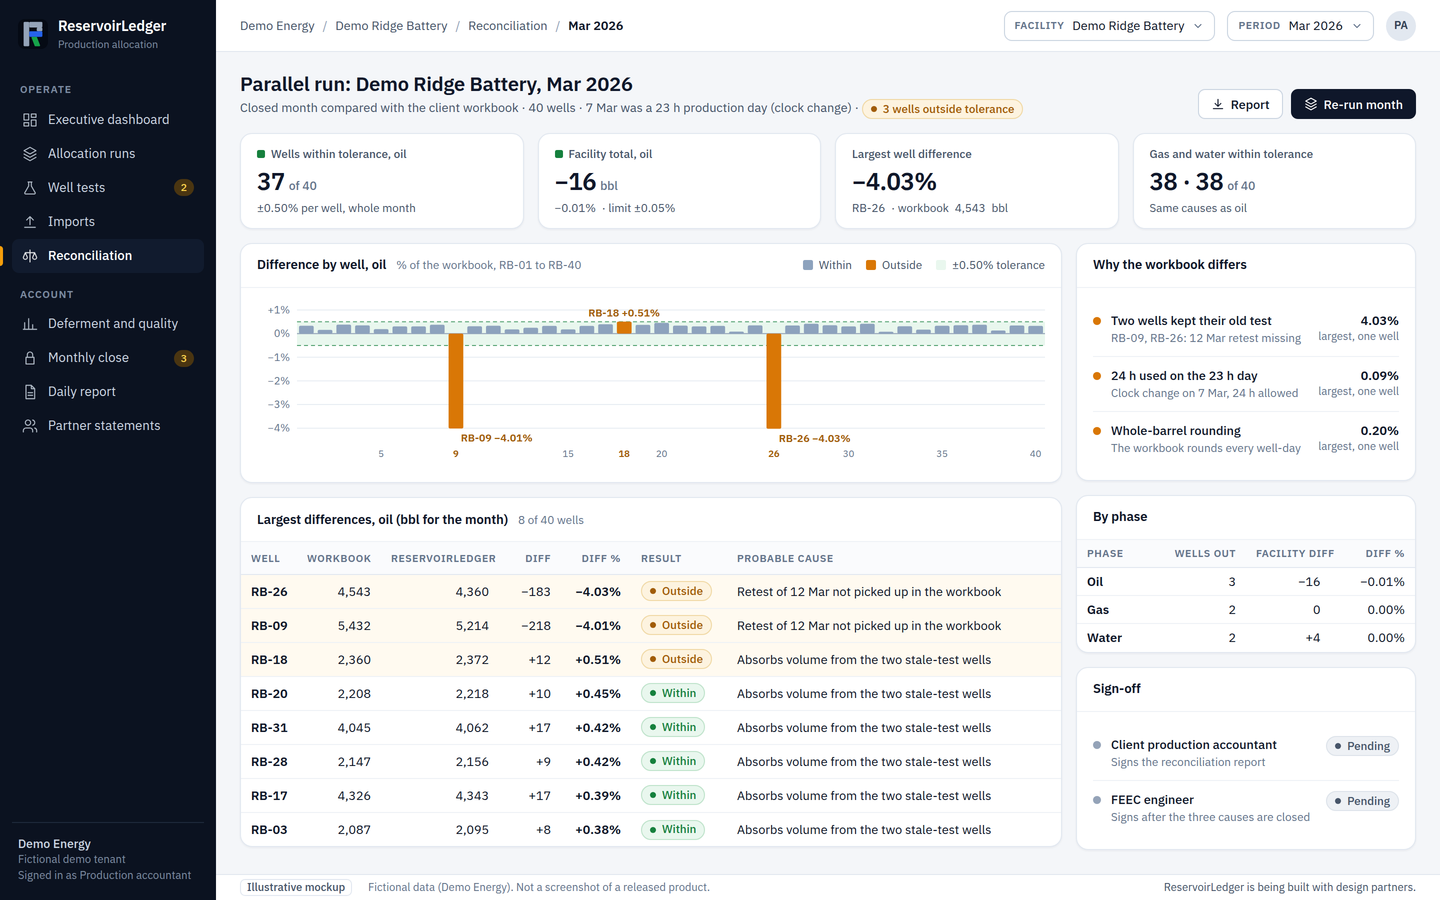
ReconciliationA parallel run against the client's own spreadsheet, well by well, with each difference measured against the agreed tolerance and traced to a cause.Illustrative mockup. Fictional data (Demo Energy). ReservoirLedger is being built with design partners. 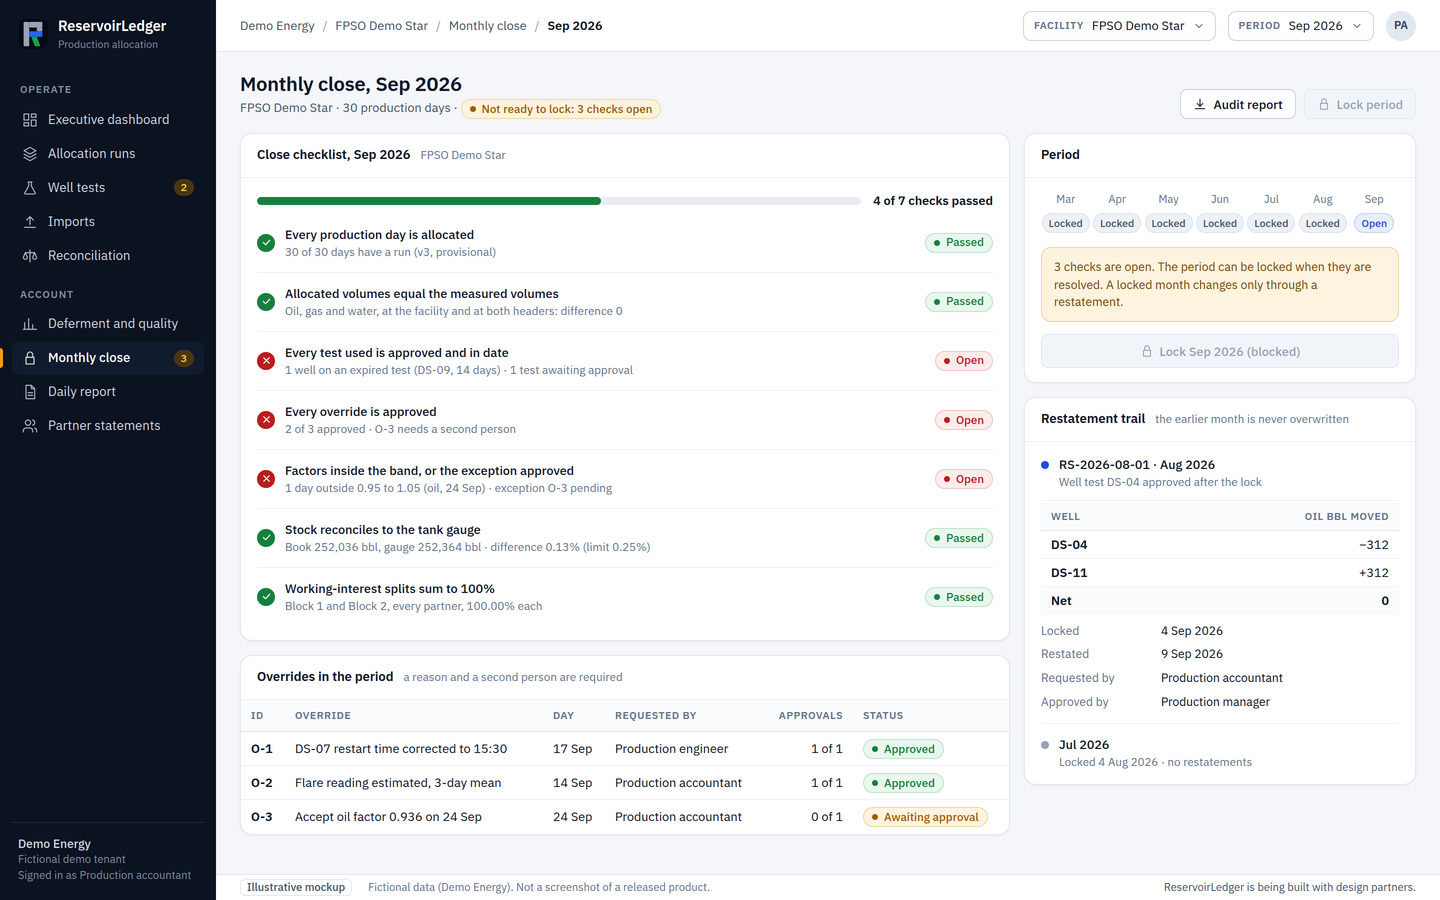
Monthly closeThe close checklist, the period lock and the restatement trail: nothing locks while a check is open, and a later change is a restatement.Illustrative mockup. Fictional data (Demo Energy). ReservoirLedger is being built with design partners. 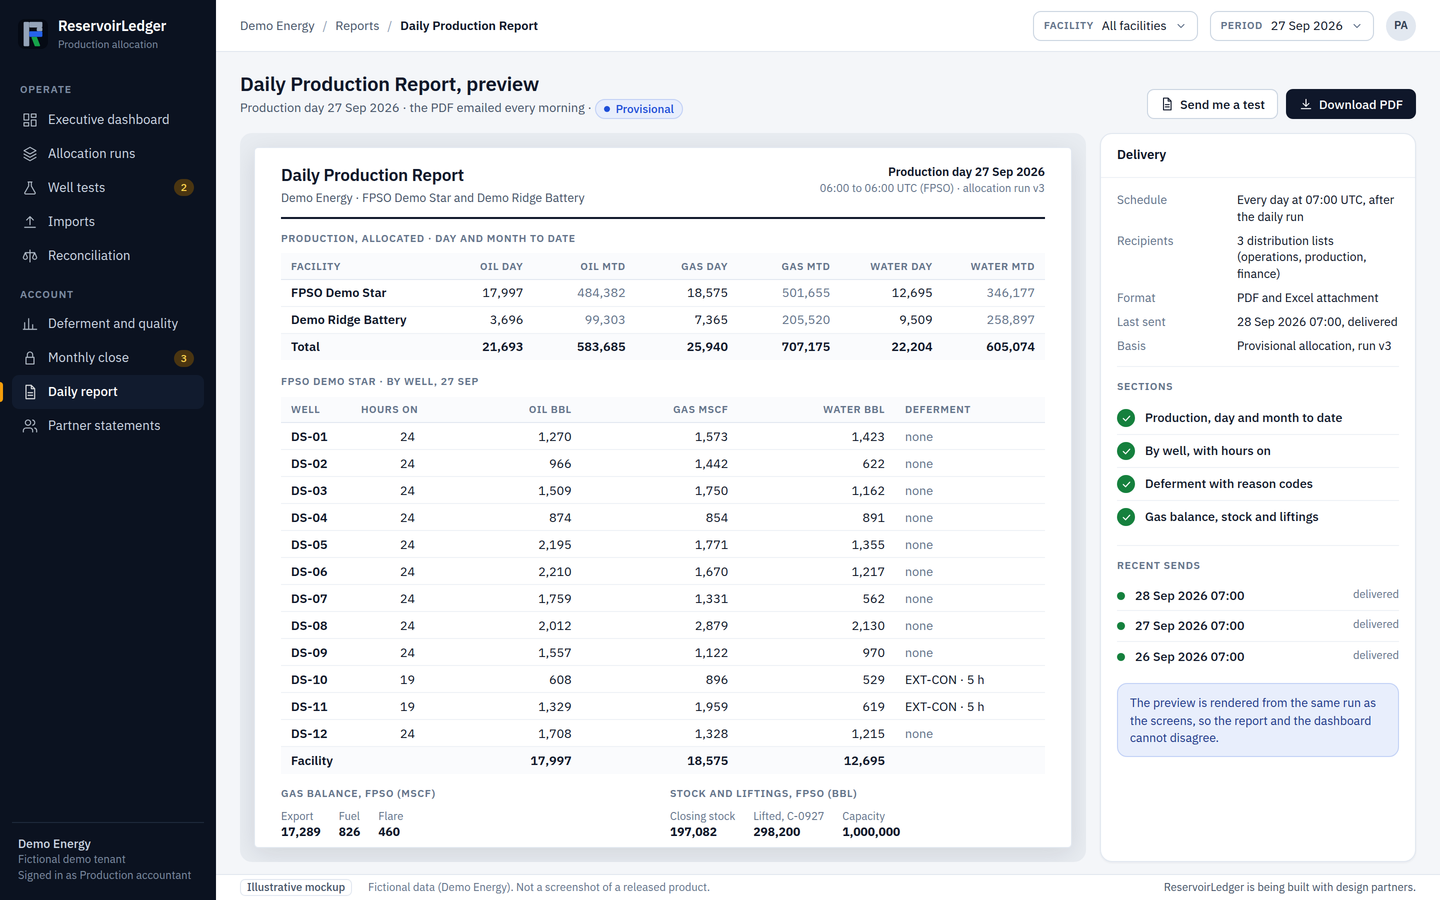
Daily Production ReportA preview of the Daily Production Report, the PDF emailed every morning: day and month to date, by well, with deferment, gas balance, stock and liftings.Illustrative mockup. Fictional data (Demo Energy). ReservoirLedger is being built with design partners. 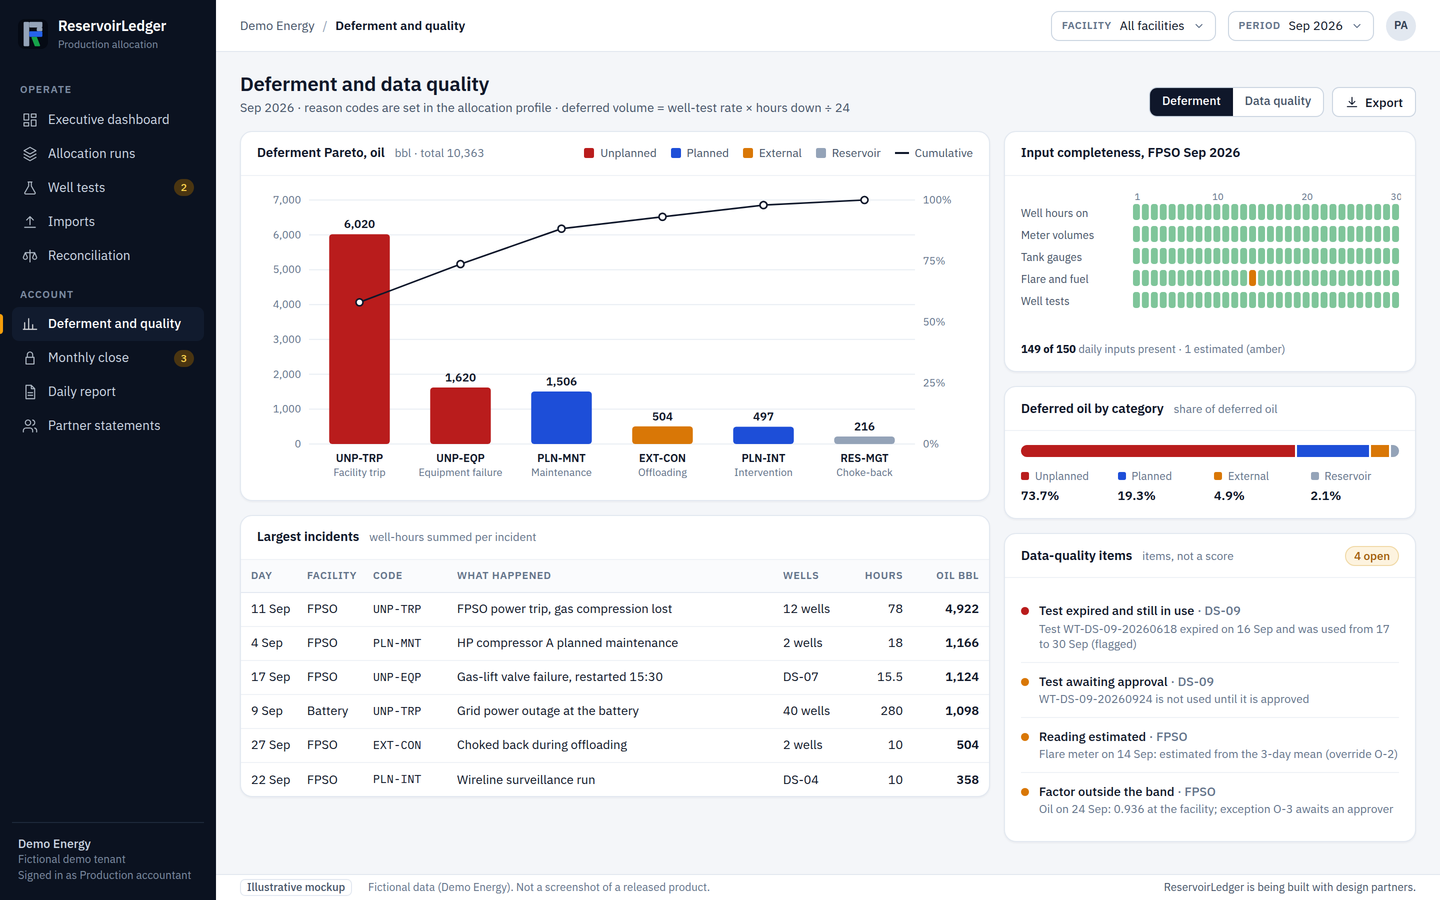
Deferment and data qualityA Pareto of deferred oil by reason code, the largest incidents, and the data-quality items open for the month.Illustrative mockup. Fictional data (Demo Energy). ReservoirLedger is being built with design partners. 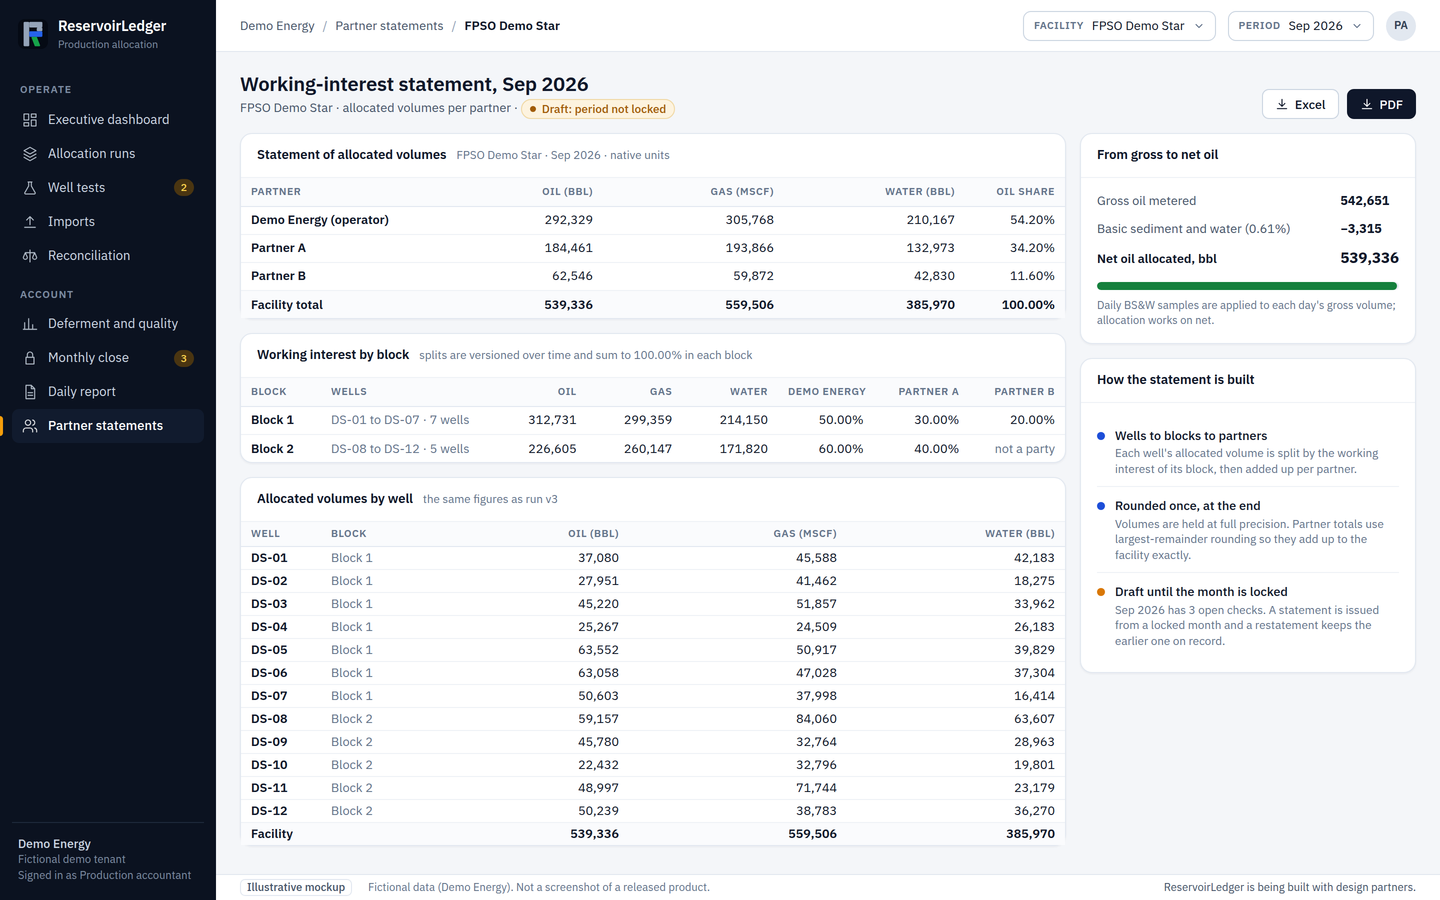
Partner statementAllocated volumes per working-interest partner for the month, from gross to net oil, adding up exactly to the facility.Illustrative mockup. Fictional data (Demo Energy). ReservoirLedger is being built with design partners.
Native units
Oil in barrels, gas in thousand standard cubic feet and water in barrels, as they are measured. Barrels of oil equivalent appear only when an operator sets its own conversion.
Numbers that add up
In the mockups, allocated volumes sum to the measured facility volume, hours on never exceed the length of the production day (23 hours on a clock-change day) and working interests sum to 100%. A script checks every figure shown.
Report profiles, not filings
Reports are customer-prepared internal outputs. ReservoirLedger is not approved, certified or endorsed by any regulator, and the client remains responsible for official volumes, royalty and regulatory submissions.
Let's talk
Tell us what the design is missing.
Design partners shape the first release. Bring your closed month and your own tolerance bands, and we will set them beside these screens.